
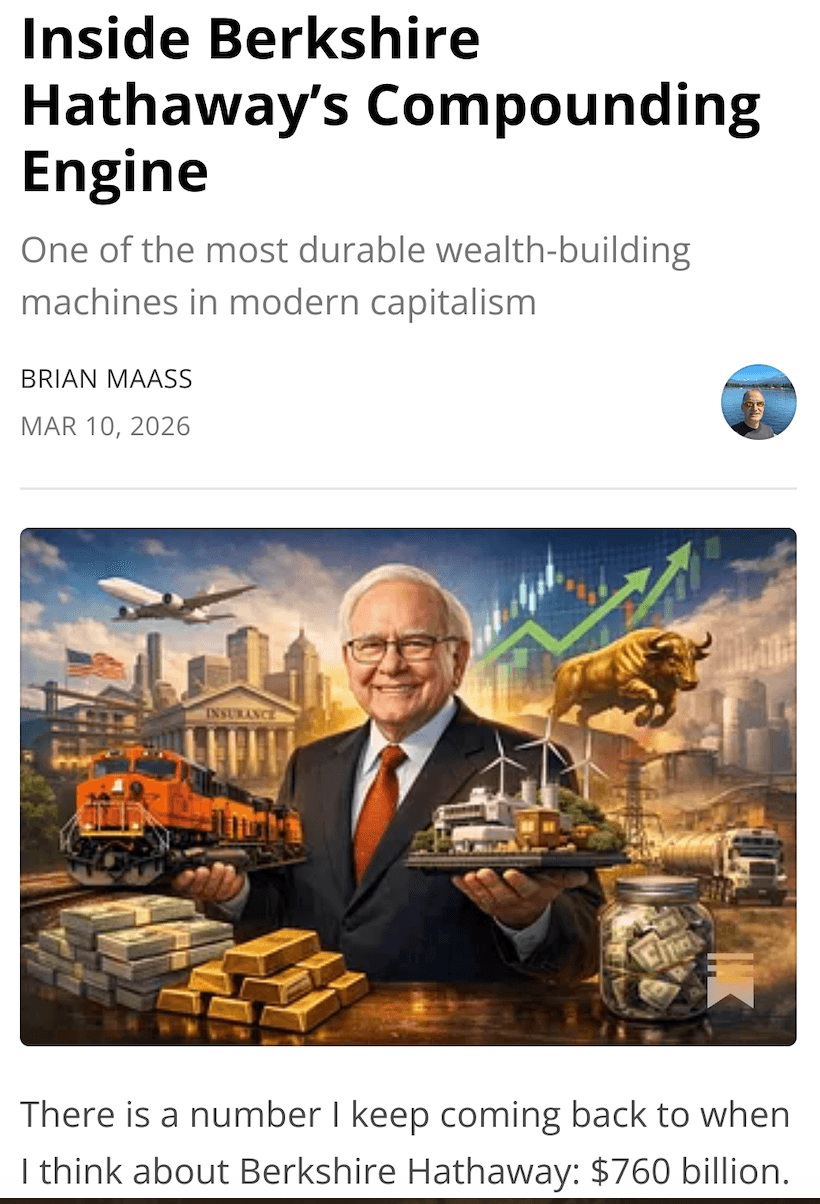
Berkshire Hathaway
Berkshire Hathaway (BRK.A / BRK.B) rallied to numerous all-time highs in 2024 and 2025 and crossed a market cap of over $1 trillion in late August 2024. There are only 8 other US companies with a higher valuation.
Despite this seemingly high valuation, Berkshire is a compounding machine having retained nearly all of its $770+ billion in earnings. No company has ever done anything like this! It's almost as if Warren is using Berkshire as an academic exercise on compounding. Berkshire Hathaway has many enduring advantages that will allow it to continue to outperform the majority of S&P500 Companies over time.
Since 2018, operating earnings are accelerating faster and share repurchases have increased. See analysis on share repurchases, updated intrinsic value estimates and 2026 price targets.
BRK.A = 1,500 shares BRK.B
BRK.A currently trades at .1% premium to BRK.B
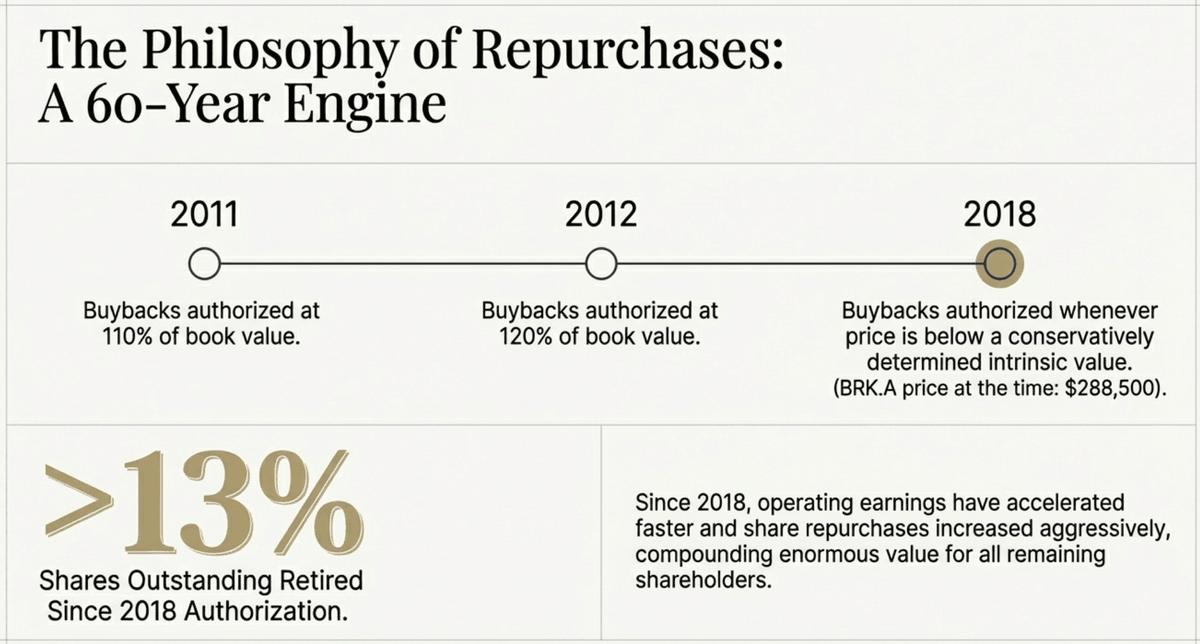
Why is the 2018 buyback change so significant?
Berkshire Hathaway has changed its buyback philosophy only three times in nearly 60 years: in 2011 (at 110% of book value), 2012 (at 120% of book value), and 2018 (below intrinsic value, conservatively determined). These changes are never made without deep, intentional consideration.
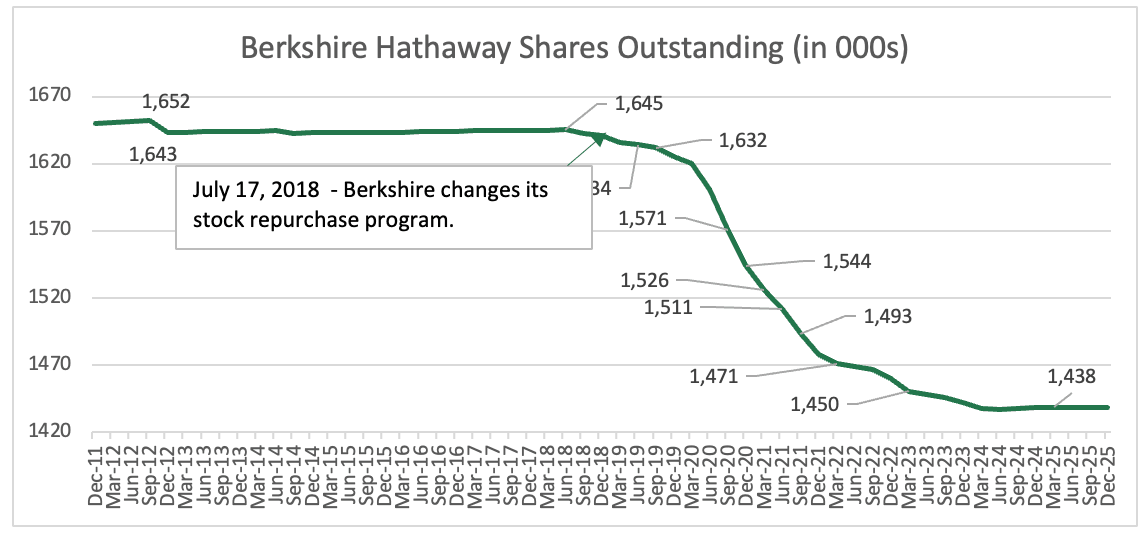
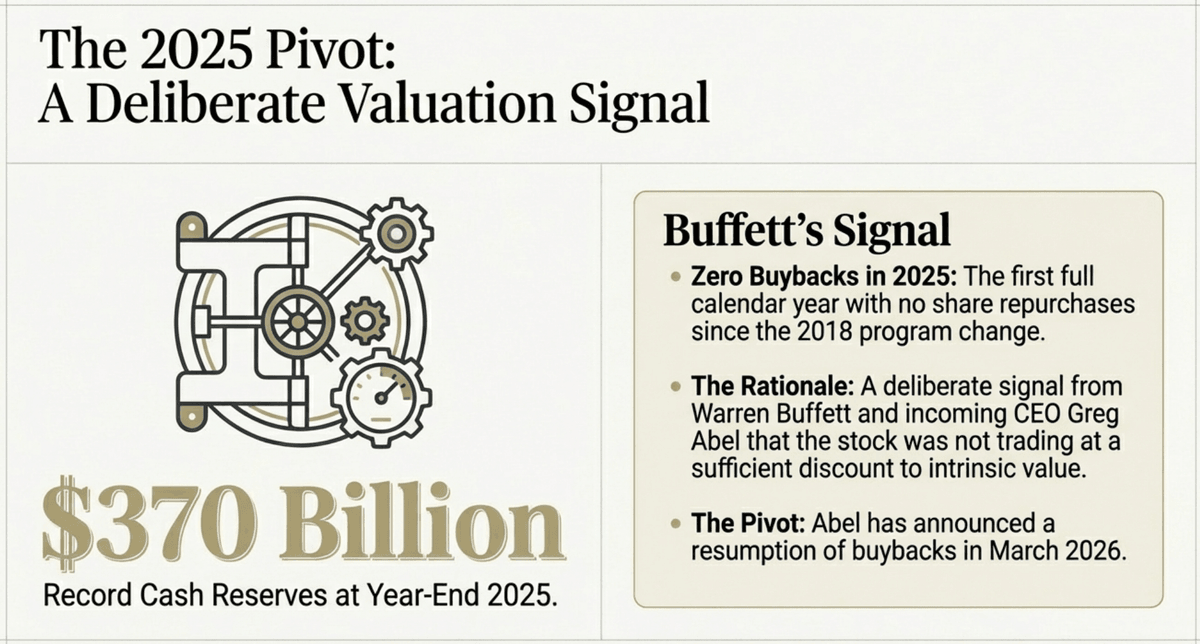
Since the 2018 authorization, Berkshire repurchased shares aggressively through 2024, retiring over 13% of shares outstanding while still growing its cash reserves to record levels exceeding $380 billion at 1Q 2026. The BRK.A share price at the time of the 2018 change was $288,500. Those repurchases have compounded enormous value for remaining shareholders.
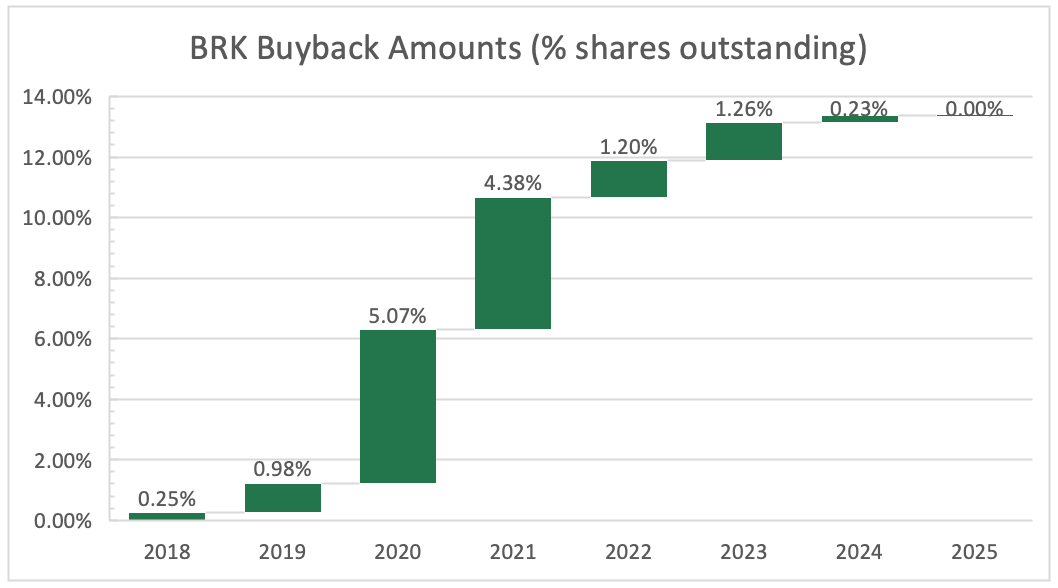
Notably, 2025 marked the first full calendar year with zero buybacks since the 2018 program change, a deliberate signal from both Buffett and incoming CEO Greg Abel that the stock was not trading at a sufficient discount to intrinsic value to warrant repurchases. Berkshire Hathaway did buyback $235 million of its own stock in 1Q 2026.
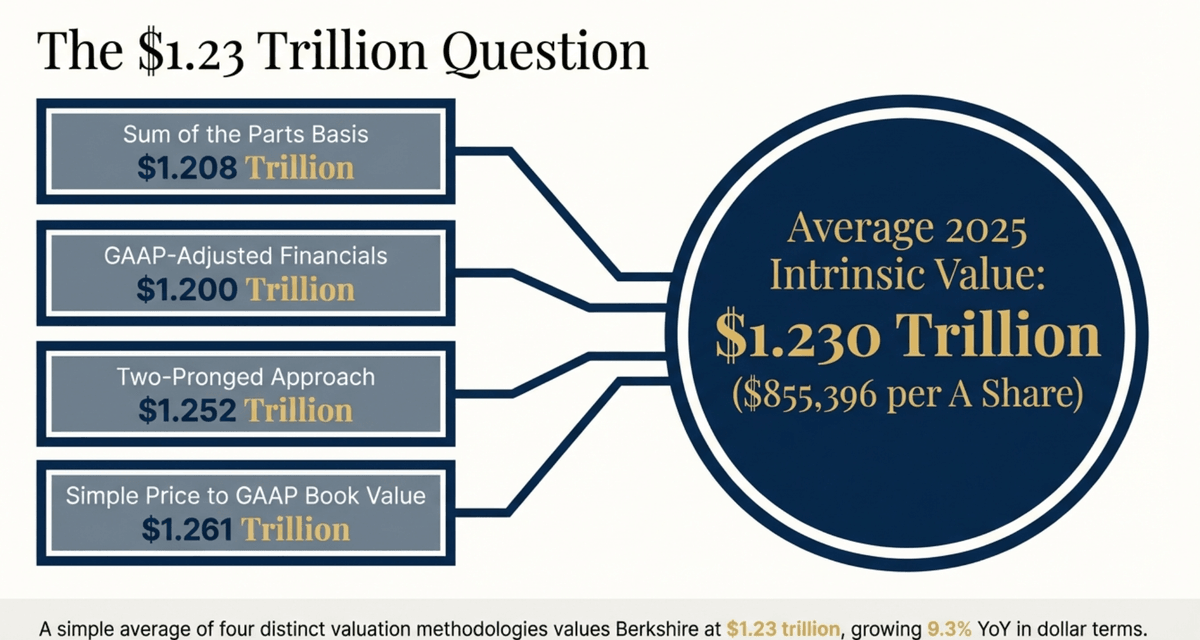
So what is Berkshire's intrinsic value? Berkshire continues to trade below its intrinsic value as conservatively determined under its own repurchase authorization, the same standard Buffett applied for 60 years. Independent analysts broadly agree: Bloomstran (Semper Augustus) pegs it at approximately $855,000 per A share, Tilson (Stansberry) at approximately $801,000, and Wall Street's most bullish analyst (UBS) at approximately $866,000. What we know is that Warren Buffett has proven extraordinarily conservative in his estimates over five decades, and these repurchases have added significant, compounding value to every remaining shareholder.
Berkshire buybacks resume in March 2026
No share repurchases since Q2 2024
Berkshire Hathaway
2026 Analyst Target Prices
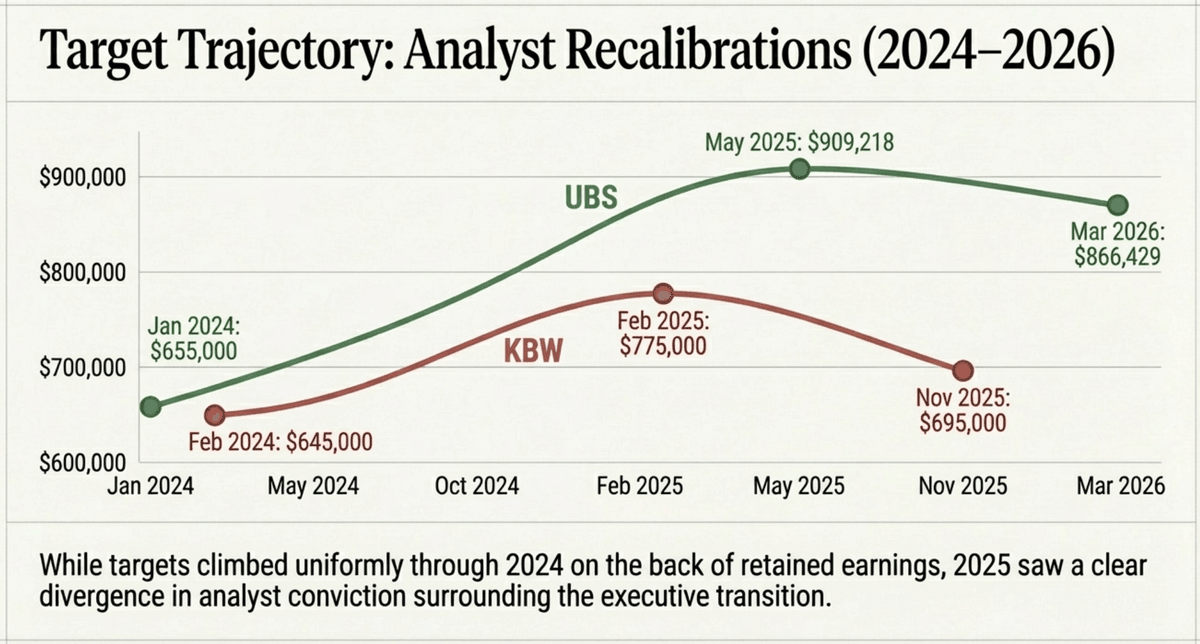
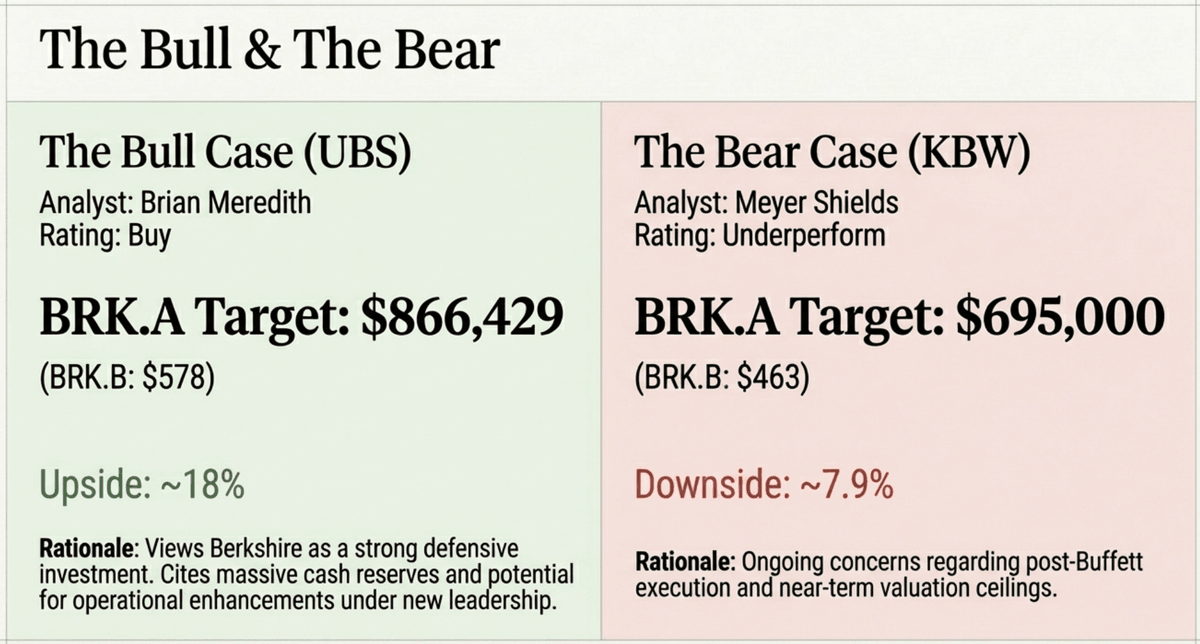
UBS (Brian Meredith) – Maintains a Buy rating on BRK.A, though has trimmed the price target from $880,905 to $866,429, citing a reassessment of near-term valuation. UBS views Berkshire as a strong defensive investment, citing its cash reserves and potential for operational enhancements despite Warren Buffett stepping down as CEO. BRK.A remains the most optimistic forecast among covering analysts, projecting roughly 18% upside from current levels.
Keefe, Bruyette & Woods (Meyer Shields) – KBW holds the most conservative view, with a BRK.A target of $695,000, the lowest among covering analysts, implying roughly 7.9% downside from current trading levels. The firm retains its Underperform rating (initiated in Oct 2025), reflecting ongoing concerns about post-Buffett execution and valuation.
Argus Research (Kevin Heal) – No updated 2026 target has been publicly reported as of early March 2026. The firm's last published BRK.B target of $575 (set in March 2025) may still be in effect pending a fresh research note following the CEO transition and Q4 2025 results. Rating: Buy (last published)
BRK.A Target ranges from $695,000-$866,429
BRK.B Target ranges from $463-$578
Berkshire Hathaway
2026 Intrinsic Value Estimates
2 well-know individuals focused on understanding the components of Berkshire Hathaway over the years (their estimates range from $801,000-$855,396/per A share)
Semper Augustus
Annual intrinsic value analysis (~60 pages) by Christoper Bloomstrand of Semper Augustus Investment Group LLC
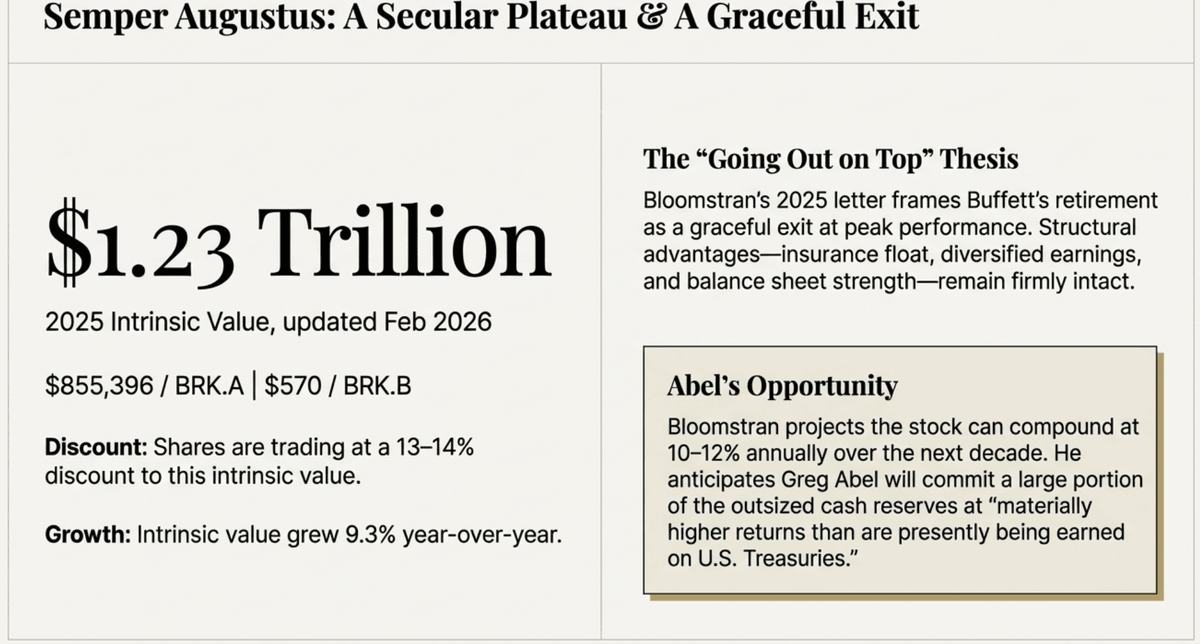
2025 - $1.23 trillion or ~$855,396/share
2025 Letter (released Feb 26, 2026) — titled "Both Sides Now: Cloud Delusions; Value at a Secular Plateau; And – Berkshire Hathaway: Going Out on Top"
Bloomstran calculates that 2025 intrinsic value grew 9.3% from $1.126 trillion to $1.23 trillion, equating to $855,396 per Class A share and $570 per Class B share. At the time of publication, Berkshire shares were trading around $745,000 (A) and $490 (B) which implies shares are trading at 13–14% discount to intrinsic value.
Bloomstran believes Greg Abel may be more aggressive with Berkshire's cash than Buffett was, writing: "It's likely that Berkshire under Greg Abel's leadership will commit a large portion of today's outsized cash reserves at materially higher returns than are presently being earned on U.S. Treasuries." He continues to project the stock can compound at 10–12% annually over the next decade, driven by disciplined capital deployment of Berkshire's still-enormous cash position.
The "Going Out on Top" subtitle reflects Bloomstran's framing of Buffett's retirement as a graceful exit at peak performance, with the structural advantages of Berkshire (insurance float, diversified earnings, and balance sheet strength) firmly intact under new leadership.
Whitney Tilson
Annual intrinsic value estimate by Whitney Tilson of Stansberry Research
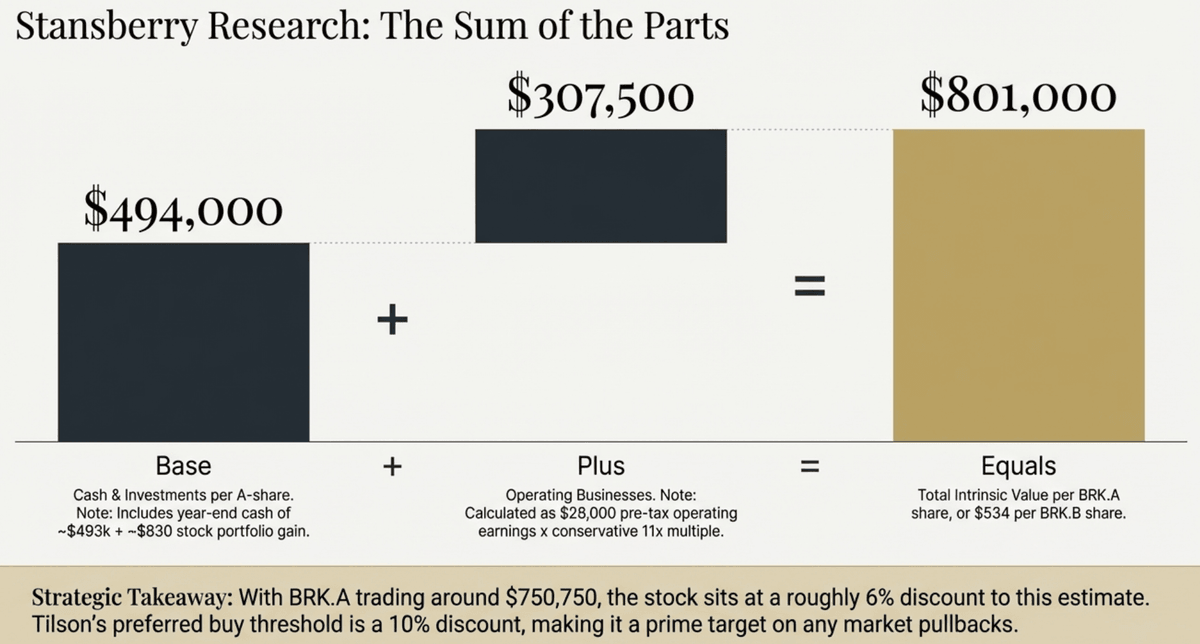
2026 - $801,000
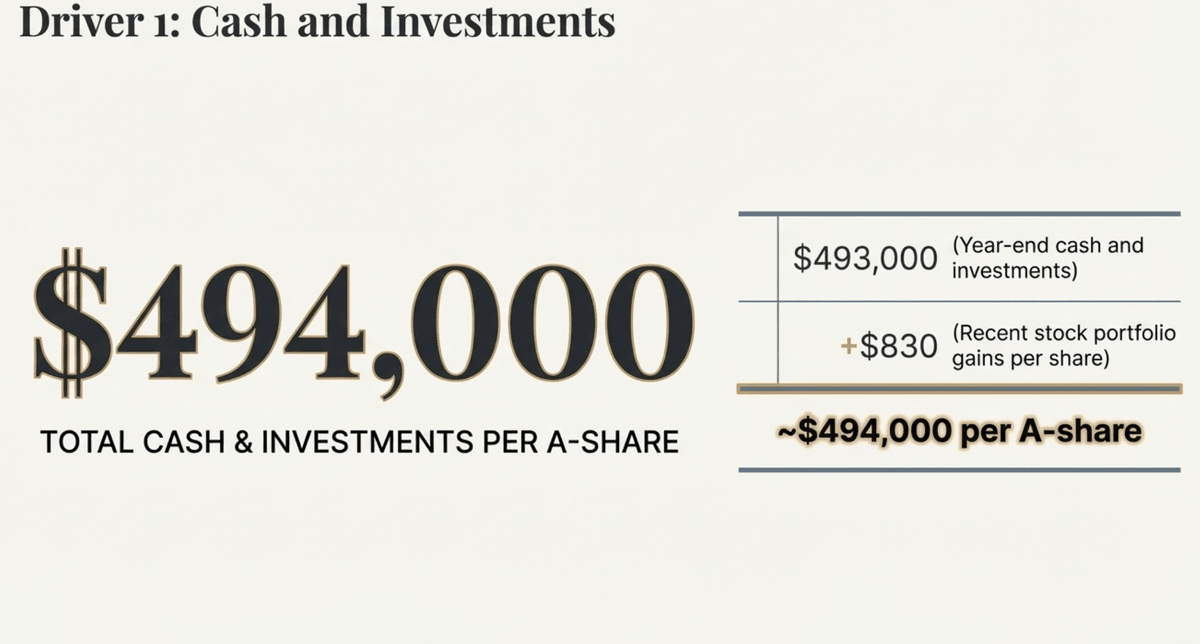
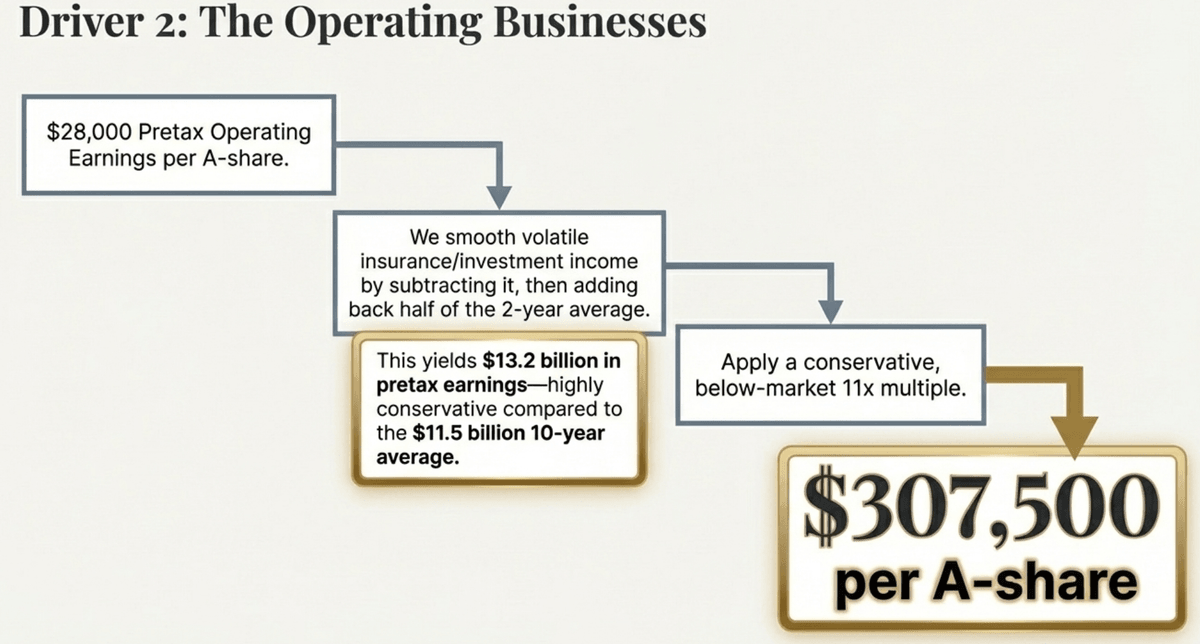
Tilson's methodology remains unchanged: cash & investments per share plus a multiple on operating earnings. At year-end, cash and investments came in at about $493,000 per A-share, and with the stock portfolio gaining roughly $830 per share since, the total is around $494,000. Pretax operating earnings were $28,000 per A-share, and applying a conservative 11x multiple yields roughly $307,500 for the operating businesses which brings total intrinsic value to approximately $801,000 per A-share, or $534 per B-share.
With Berkshire closing at $750,750 per A-share, the stock is trading at a roughly 6% discount to his estimate leading Tilson to say he expects Berkshire to slightly beat the S&P 500 over the next five years, with a bias toward the upside due to new leadership under Abel.
Tilson notes this puts the stock close to his preferred buy threshold of a 10% or greater discount to intrinsic value, and recommends keeping a close eye on it to take advantage of any pullbacks.